
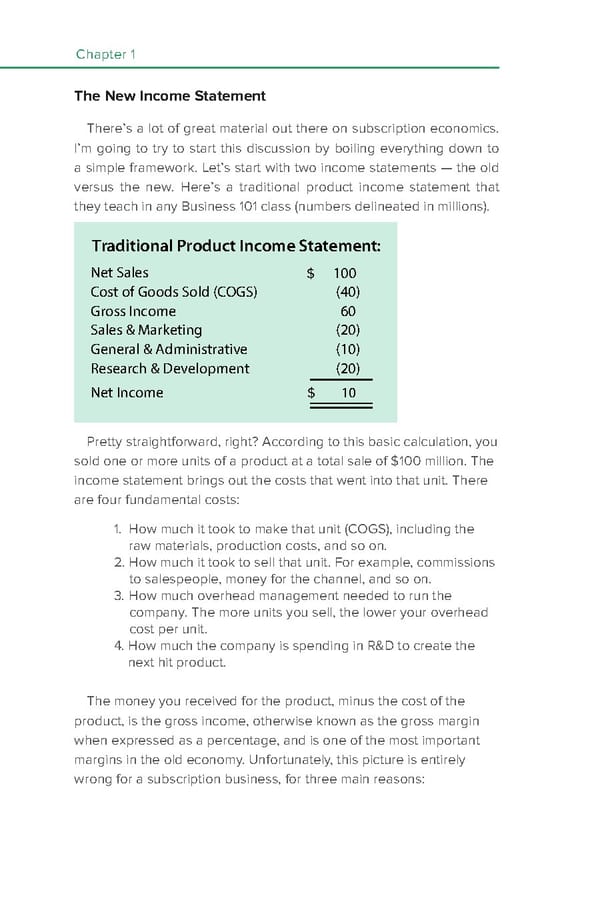
Chapter 1 The New Income Statement There’s a lot of great material out there on subscription economics. I’m going to try to start this discussion by boiling everything down to a simple framework. Let’s start with two income statements — the old versus the new. Here’s a traditional product income statement that they teach in any Business 101 class (numbers delineated in millions). Traditional Product Income Statement: Net Sales $ 100 Cost of Goods Sold (COGS) (40) Gross Income 60 Sales & Marketing (20) General & Administrative (10) Research & Development (20) Net Income $ 10 Pretty straightforward, right? According to this basic calculation, you sold one or more units of a product at a total sale of $100 million. The income statement brings out the costs that went into that unit. There are four fundamental costs: 1. How much it took to make that unit (COGS), including the raw materials, production costs, and so on. 2. How much it took to sell that unit. For example, commissions to salespeople, money for the channel, and so on. 3. How much overhead management needed to run the company. The more units you sell, the lower your overhead cost per unit. 4. How much the company is spending in R&D to create the next hit product. The money you received for the product, minus the cost of the product, is the gross income, otherwise known as the gross margin when expressed as a percentage, and is one of the most important margins in the old economy. Unfortunately, this picture is entirely wrong for a subscription business, for three main reasons:
 Subscription Economics Page 7 Page 9